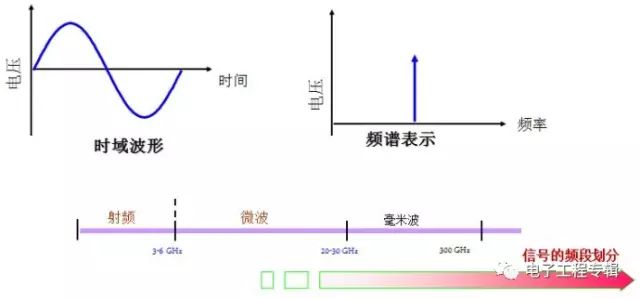
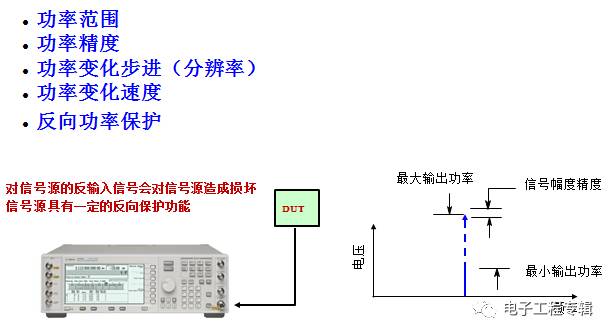
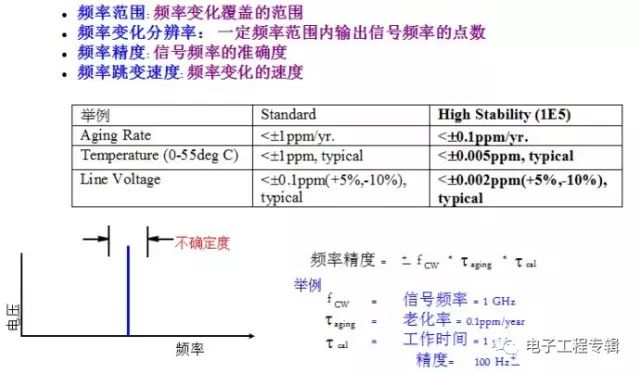
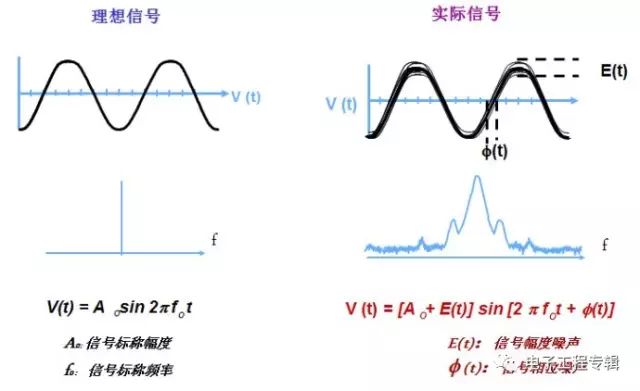
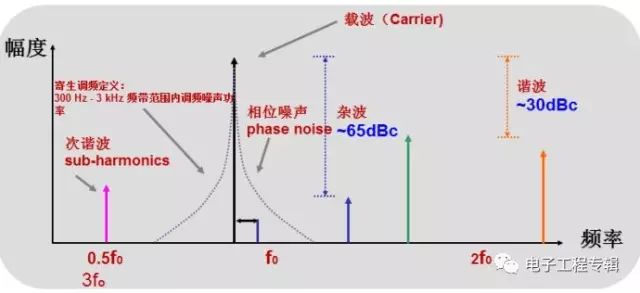
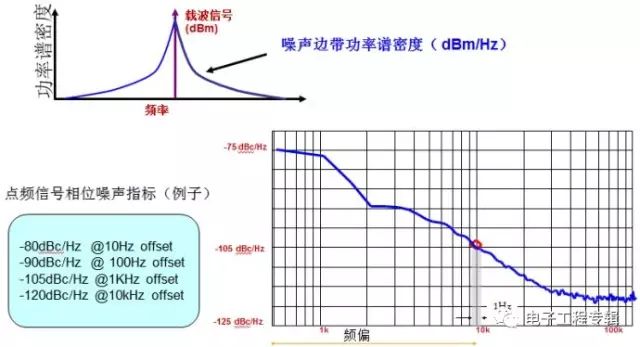
The signal source is one of the four essential electronic measurement instruments, alongside network analyzers, spectrum analyzers, and oscilloscopes. This section introduces the fundamental concepts related to signal sources. The most common function of a signal source is to generate a sine wave, so we begin by discussing the characteristics of such a waveform. First, let's explore the characteristics of a sine wave. A sine wave can be described mathematically with an equation that includes key parameters: amplitude, frequency, and initial phase. Together, the frequency and initial phase contribute to the overall phase information of the signal. An ideal sine wave has deterministic values for amplitude, frequency, and phase, making it a relatively simple type of signal. To define a continuous wave signal, only two parameters are typically needed: amplitude and frequency. Figure 1: Sine Wave Signal Characteristics Typical amplitude parameters for a sine wave generated by a signal source include peak-to-peak voltage, RMS voltage, and DC offset. These values are crucial for ensuring accurate and repeatable measurements in various applications. Figure 2: Typical Amplitude Parameters of the Sine Wave Output from the Signal Source Signal sources must maintain high amplitude accuracy to ensure reliable test results and minimize measurement uncertainty. This is especially important in applications where precision is critical. When considering the frequency parameters of a signal source, several factors come into play, including frequency stability, resolution, and accuracy. These aspects determine how well the signal source can produce and maintain a desired frequency over time. Figure 3: Typical Frequency Parameters of the Sine Wave Output from the Signal Source The frequency accuracy of a signal source depends on the quality of its reference oscillator and the time elapsed since the last calibration. In real-world scenarios, actual sine waves are more complex than ideal ones. They may exhibit phase noise, parasitic frequency modulation, and spurs, which can affect signal integrity. Figure 4: Signal Characteristics of the Actual Sine Wave Evaluating the quality of a sine wave or continuous wave signal primarily involves analyzing it in the frequency domain. Spurious components in the frequency domain consist of both continuous and discrete elements, which correspond to distortions in the time domain. Continuous noise sidebands are referred to as phase noise, while discrete spurs can be categorized as harmonics or clutter based on their relationship with the fundamental frequency. Phase noise is mainly caused by internal noise within the oscillator, whereas harmonic clutter arises from the nonlinearity of the device. For example, if a nonlinear device is used, the output may contain higher-order harmonics due to the non-linear transfer function: Vo(t) = a1vi(t) + a2vi²(t) + a3vi³(t) + ... If the input is a pure sine wave, the output becomes: Vo(t) = a1sin(wt) + a2sin²(wt) + a3sin³(wt) + ... = a2/2 + a1sin(wt) + 3a3/4sin(wt) + a2/2sin(2wt) + a3/4sin(3wt) + ... Figure 5: Phase Noise Definition of a Sinusoidal Signal The phase noise indicator is typically expressed in the frequency domain as the ratio of single-sideband (SSB) noise power spectral density to the carrier power at a specific offset. The frequency offset range usually spans from 10 Hz to 1 MHz, with the horizontal axis represented logarithmically. Ethernet switch,Desktop switch,Gigabit Switch,Industrial Switch,TP link switch Dongguan Jinglin Communication Technology Co., Ltd. , https://www.jlpcba.com