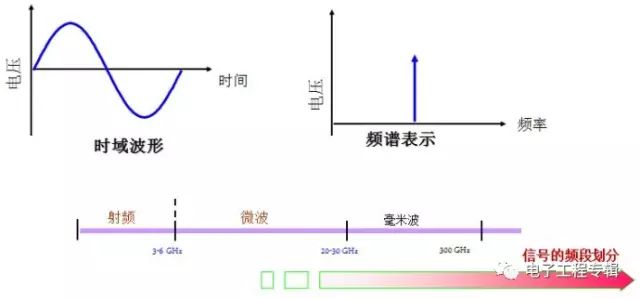
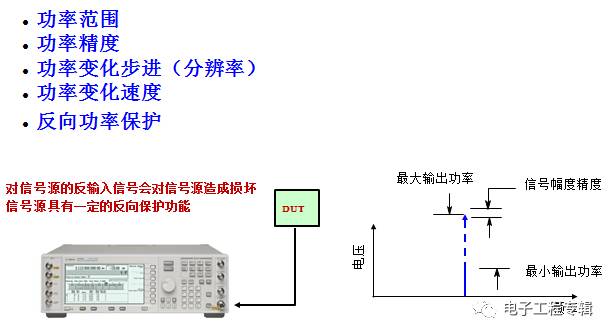
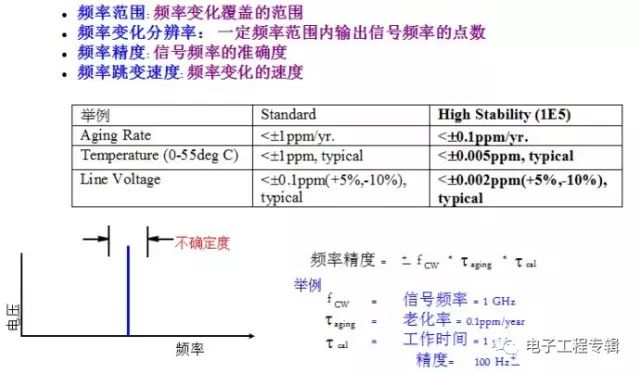
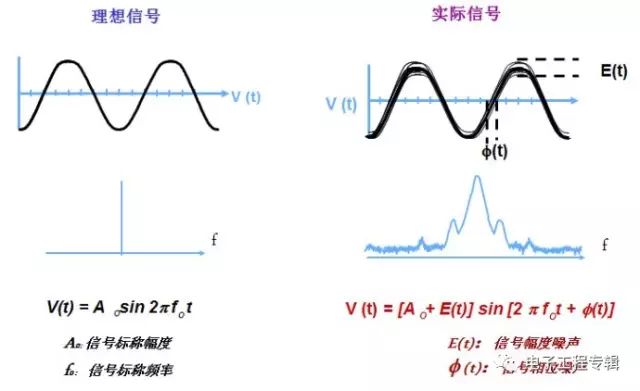
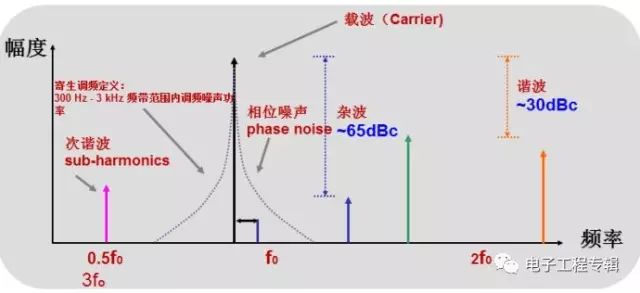
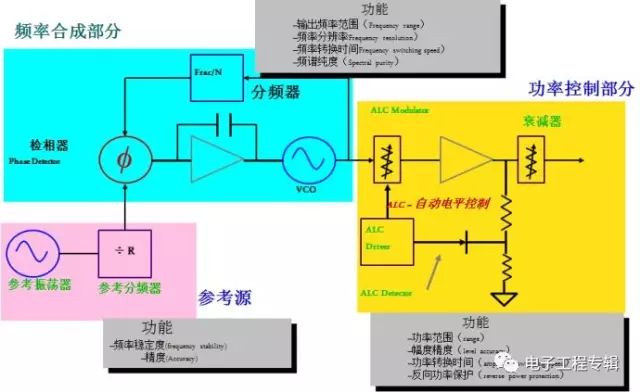
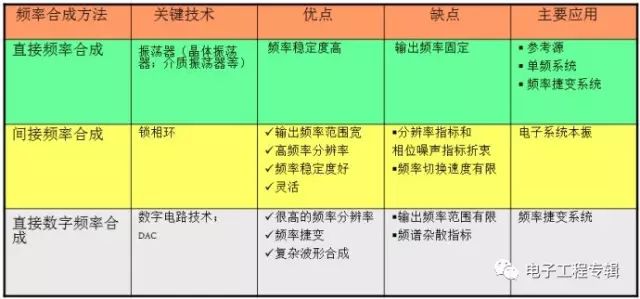
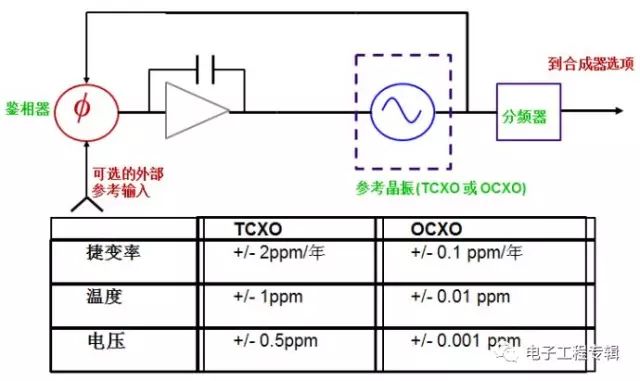
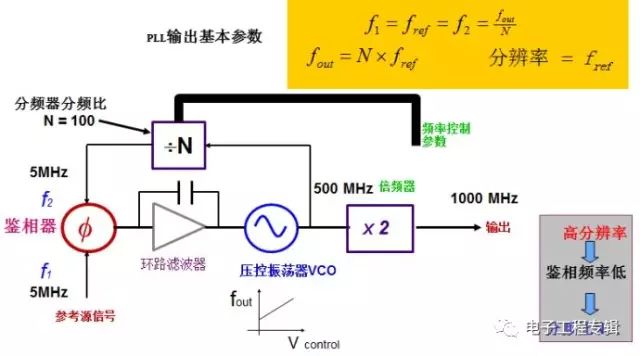
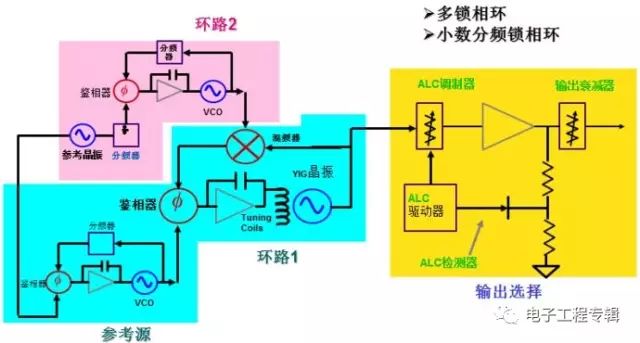
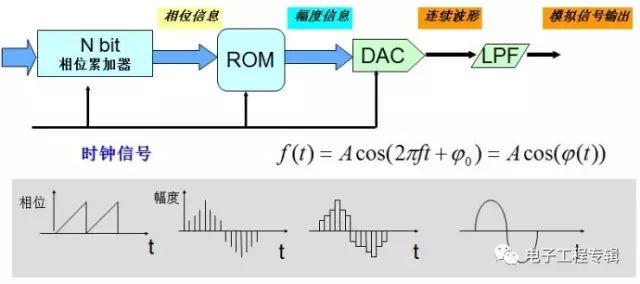
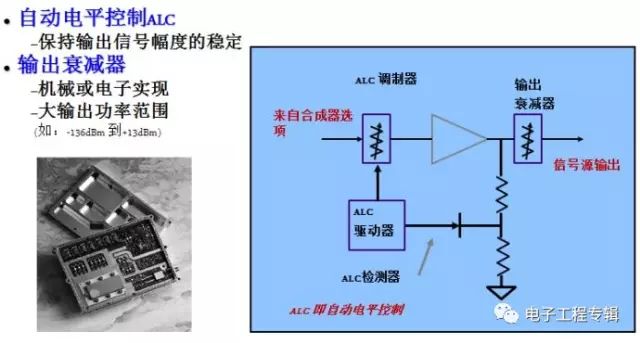
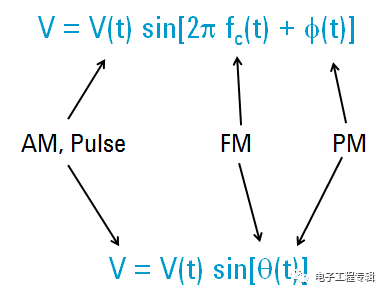
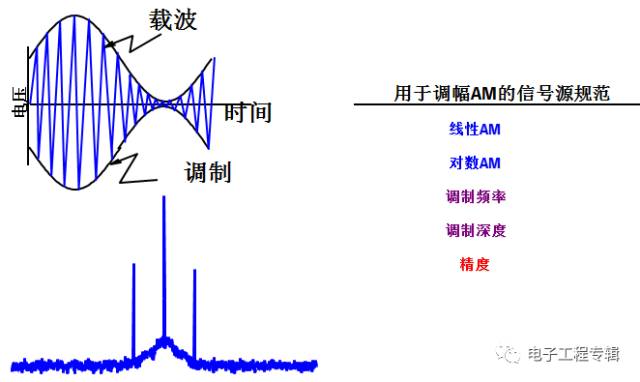
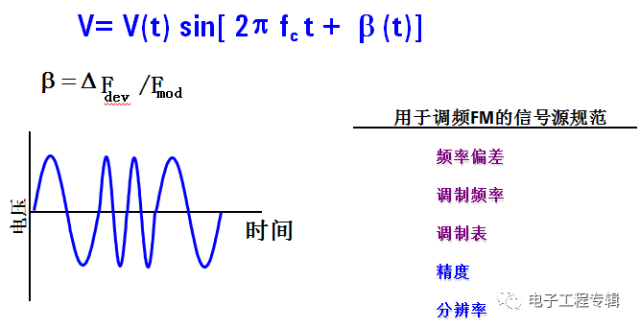
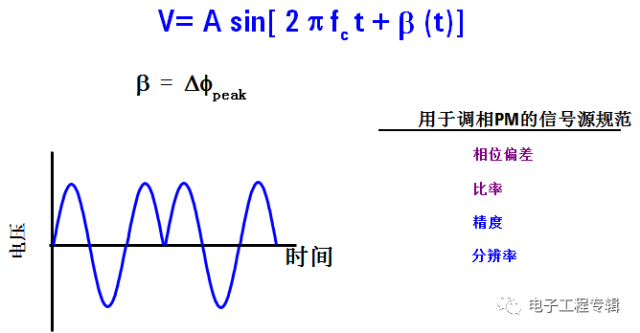
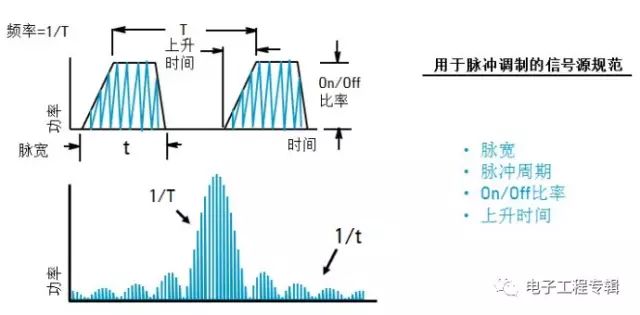
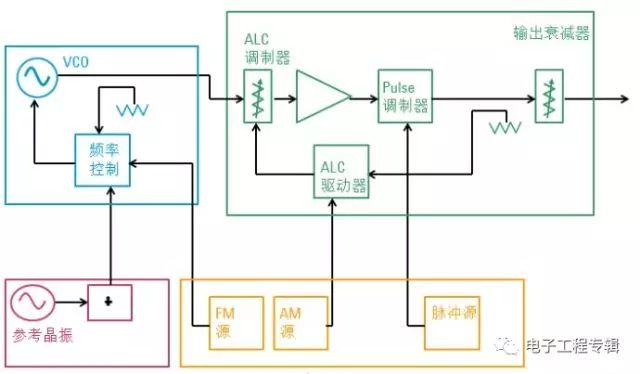
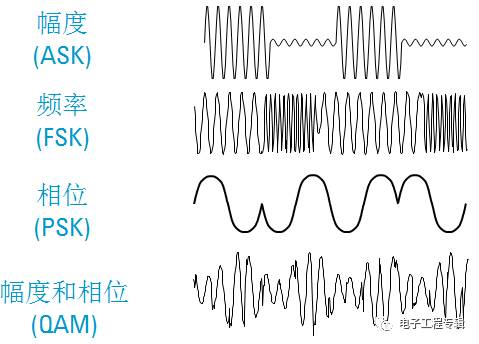
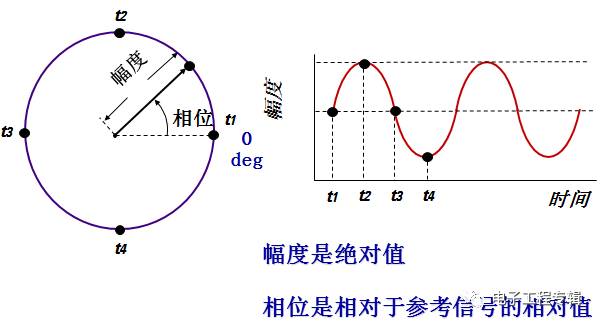
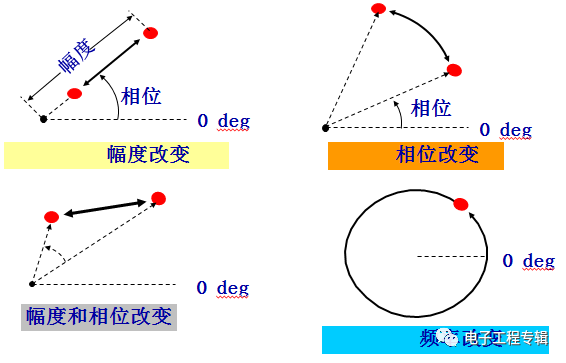
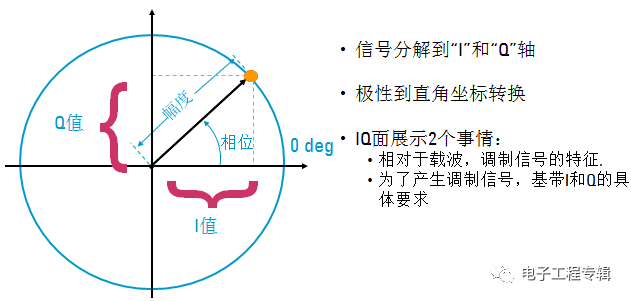
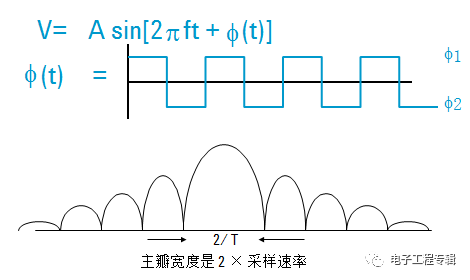
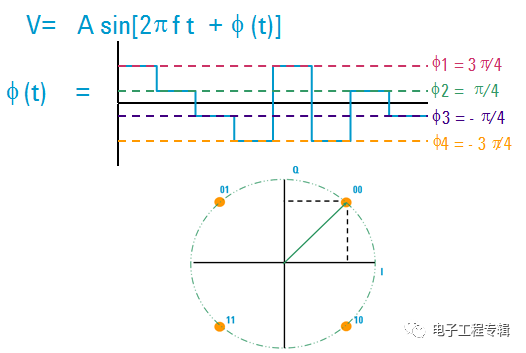
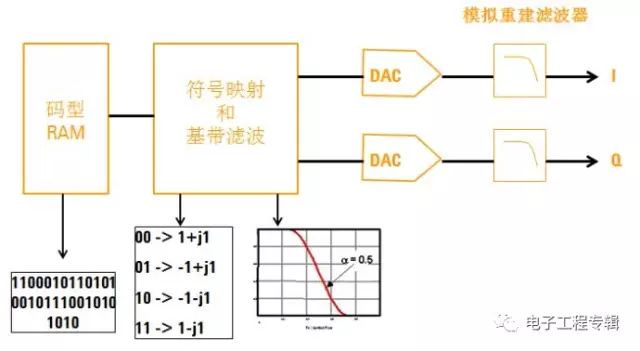
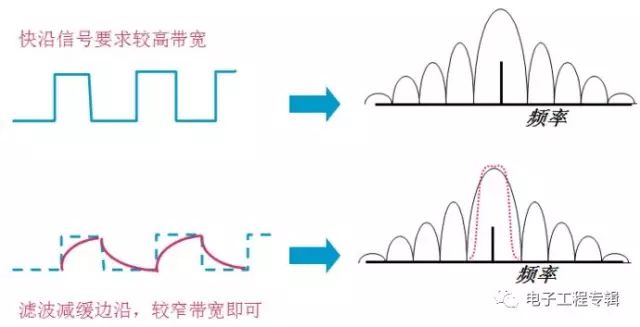
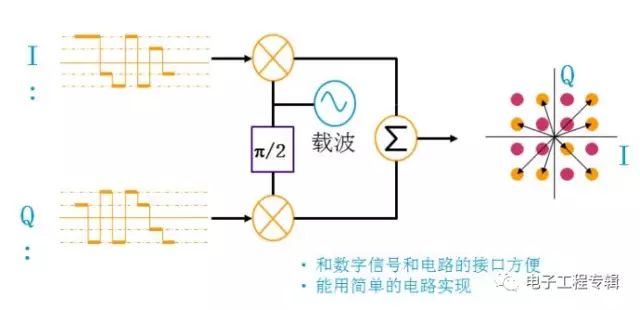
A signal source is one of the four fundamental electronic measurement instruments, alongside network analyzers, spectrum analyzers, and oscilloscopes. This section introduces the basics of signal sources, focusing primarily on the sine wave, which is the most commonly generated waveform. Understanding the characteristics of a sine wave provides a solid foundation for comprehending more complex signals. The sine wave can be described mathematically by an equation that defines its amplitude, frequency, and initial phase. These parameters determine the shape and behavior of the signal in both time and frequency domains. While frequency and initial phase are often grouped under the broader concept of phase information, the amplitude represents the signal's strength or magnitude. In an ideal scenario, a sine wave has fixed and predictable amplitude, frequency, and phase. This makes it a relatively simple signal to generate and analyze. To define a continuous wave, only two parameters—amplitude and frequency—are typically required. However, real-world signals often deviate from this ideal due to various factors such as noise and non-linearities. Figure 1: Sine Wave Signal Characteristics Typical amplitude parameters for a sine wave include peak-to-peak voltage, RMS value, and DC offset. These values help in understanding the signal's power and dynamic range. For example, the peak-to-peak amplitude gives an idea of the maximum variation in the signal, while the RMS value is useful for calculating power levels. Figure 2: Typical Amplitude Parameters of Sine Wave Output Ensuring accurate amplitude output is crucial for reliable testing and minimizing measurement uncertainty. Signal sources must maintain high precision in their amplitude control to ensure consistency across multiple test cycles. Frequency parameters are equally important. A sine wave's frequency determines how quickly it completes a cycle, and precise frequency control is essential for applications like communication systems and calibration standards. Key frequency-related metrics include frequency stability, accuracy, and resolution. Figure 3: Typical Frequency Parameters of Sine Wave Output Real-world sine waves are not perfect. They often exhibit imperfections such as phase noise, parasitic frequency modulation, and spurious components. These distortions can affect signal integrity and need to be carefully analyzed and controlled. Figure 4: Signal Characteristics of Actual Sine Wave Evaluating the quality of a sine wave involves examining its frequency domain representation. Spurious components in the frequency spectrum can indicate distortion or unwanted interference. Continuous noise sidebands are referred to as phase noise, while discrete spurs may be harmonics or other forms of distortion. Phase noise arises from internal oscillator noise, while harmonic distortion results from non-linearities in the system. The mathematical model of a non-linear system shows that input sinusoids can produce outputs with higher-order harmonics, leading to spectral content beyond the original frequency. The phase noise metric is defined in the frequency domain and is expressed as the ratio of single-sideband (SSB) noise power spectral density to the carrier power at a given frequency offset. This measurement is critical for assessing signal purity and stability in high-performance systems. Point frequency signal sources are designed to generate specific frequencies with high accuracy and stability. They typically consist of three main sections: a reference source, a frequency synthesizer, and an output power control unit. Each component plays a key role in determining the overall performance of the signal source. Figure 6: Signal Source Block Diagram There are three primary methods of frequency synthesis: direct synthesis, indirect (PLL-based) synthesis, and direct digital synthesis (DDS). Each method has its own advantages and limitations in terms of frequency range, resolution, and phase noise performance. Direct frequency synthesis uses crystal oscillators to generate the desired frequency directly. It offers excellent stability but limited flexibility in frequency adjustment. Indirect synthesis via PLL allows for a wider frequency range and finer tuning, though it can introduce trade-offs between phase noise and frequency step size. DDS, on the other hand, provides high-frequency resolution and fast switching speeds, but with a narrower operational frequency range. Figure 7: Signal Source Frequency Synthesis Techniques and Their Pros and Cons The block diagram of a direct frequency synthesis system includes a reference oscillator, frequency multipliers, and filters. Temperature-compensated and constant-temperature crystal oscillators are used to improve stability and reduce drift over time. Figure 8: Block Diagram of Direct Frequency Synthesis Indirect synthesis using a PLL involves a phase detector, loop filter, VCO, and frequency divider. The PLL effectively acts as a frequency multiplier, allowing for fine control over the output frequency. However, the relationship between phase noise and frequency step size must be carefully managed to maintain optimal performance. Figure 9: Block Diagram of Indirect Frequency Synthesis The phase noise of a PLL output is influenced by both the reference source and the VCO. Reducing the frequency division ratio N can improve phase noise performance, which can be achieved through advanced techniques like fractional-N PLLs and multi-loop architectures. Figure 10: Method for Improving PLL Output Phase Noise Direct digital synthesis (DDS) is a modern technique that uses digital signal processing to generate waveforms. It consists of a phase accumulator, lookup table, DAC, and low-pass filter. This approach allows for high-resolution frequency control and fast switching, making it suitable for a wide range of applications. Figure 11: Block Diagram of DDS Direct Digital Synthesis Signal sources use Automatic Level Control (ALC) to maintain consistent output amplitude. ALC adjusts the signal level based on feedback, ensuring that the output remains stable even under varying load conditions. Figure 12: Control of Signal Source Output Power Point frequency signal sources are widely used in various applications, including local oscillator generation, device distortion testing, and receiver evaluation. They also support scanning functions, such as frequency and power sweeps, to facilitate comprehensive testing. Analog signal generators are used to create modulated signals, where the carrier signal is altered by an information-bearing signal. Common analog modulation types include amplitude modulation (AM), frequency modulation (FM), and phase modulation (PM). These techniques allow information to be transmitted efficiently over long distances. Figure 13: Position of Modulation Information AM involves varying the amplitude of the carrier signal in proportion to the modulating signal. FM changes the frequency of the carrier, while PM alters its phase. These techniques are fundamental to traditional communication systems and remain relevant in many applications today. Figure 14: Amplitude Modulation (AM) Figure 15: Frequency Modulation (FM) Figure 16: Phase Modulation (PM) Figure 17: Pulse Modulation Figure 18: Analog Modulation Signal Source Block Diagram Vector signal generators are used for digital modulation, where the signal is represented in the I/Q plane. This allows for more complex modulation schemes, such as QPSK and 16QAM, to be implemented with high precision. Figure 19: Waveform Comparison of Various Modulation Methods In polar coordinates, a vector can represent the amplitude and phase of a sine wave. As the vector rotates, it corresponds to a complete cycle of the sine wave. The direction of the vector indicates the phase, while its length represents the amplitude. Figure 20: Vector Representation of a Sine Wave in Polar Coordinates I/Q demodulation is a powerful technique for analyzing modulated signals. By separating the signal into in-phase (I) and quadrature (Q) components, it becomes easier to measure amplitude, phase, and frequency variations. This method is widely used in modern communication systems and signal analysis tools. Figure 21: Signal Changes in Polar Coordinates Eye diagrams are a visual tool for evaluating digitally modulated signals. They show the signal’s amplitude over time, revealing the quality of the modulation and the presence of any distortions. A well-formed eye diagram indicates good signal integrity and minimal noise. Figure 22: IQ Format Coordinates Figure 23: BPSK Time Domain and Frequency Domain Characteristics Figure 24: QPSK Time Domain and Constellation Mapping Figure 25: I and Q Eye Diagram Figure 26: QAM Vector and Constellation Figure 27: Comparison of Vector Modulation Features Figure 28: Block Diagram of the Vector Signal Generator Figure 29: Baseband Signal Generator in Vector Signal Generator Figure 30: Filter in the Baseband Signal Generator The IQ modulator combines the I and Q signals using a local oscillator with a 90-degree phase shift, ensuring that they do not interfere with each other. This process generates a composite signal that carries the modulated information. Figure 31: Main Application of the IQ Modulator Vector signal generators have a variety of applications, including generating specific vector signals, measuring receiver sensitivity, evaluating receiver gating performance, and testing device distortion. These tools are essential for developing and validating modern communication systems. PV Inverter PCBA,Wind Power Converter PCBA,Energy Storage System Control PCBA,Photovoltaic inverter PCBA,Energy Storage Module PCBA Dongguan Jinglin Communication Technology Co., Ltd. , https://www.jlpcba.com